ポリゴン内のラインデータの抽出(切取り)
何回も調べたりしているため、メモ。
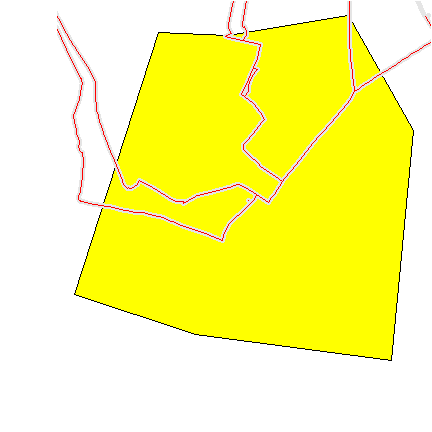
ポリゴン内のライン長さを出したいときがある。 その際はラインをポリゴンでインターセクトする必要がある。
関数はrgeos::gIntersection()を利用する。
sp::over()関数で行うと意図と異なる結果となるため注意。
(適切な方法で行えば実行できるだろうが。。。)
library(stplanr)
library(magrittr)
data(routes_fast)
data(zones)
- よい例
plot(zones[3,], col = "yellow")
plot(routes_fast, col ="grey90", add = T, lwd = 5)

rgeos::gIntersection(spgeom1 = routes_fast,
                     spgeom2 = zones[3,]) %>%
  plot(add = T, col = "blue")

- ダメな例
plot(zones[3,], col = "yellow")
plot(routes_fast, col ="grey90", add = T, lwd = 5)

tmp <-
  sp::over(x = routes_fast, y = zones[3, ])

plot(routes_fast[!is.na(tmp$geo_code), ], add = T, col = "red",
     lwd = 1)
sf classデータの操作及びプロット
sfパッケージ(クラス)は空間データを簡単に操作することができ非常に便利である。
spパッケージ(クラス)はそれらを扱う多様なパッケージが存在するが、
自分自身で多少の編集を行うのは少し面倒であった。
Simple Features for Rだけあってデータ操作は簡単に行うことができる。
dplyr関係のものもサポートされており、
ggplot2パッケージではこれらのクラスを扱うgeom_sf()関数も開発されており、
今後も開発が活発に行われることが想像される。
簡単な例題を残しておく
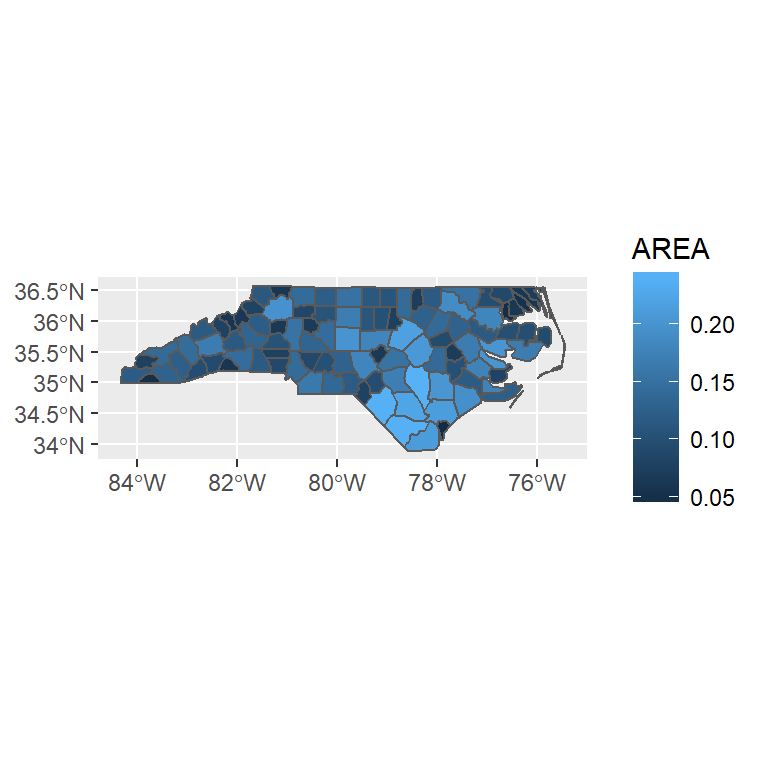
- mutate
nc <- sf::st_read(system.file("shape/nc.shp", package = "sf"), quiet = TRUE)
nc %>%
  mutate(A2 = AREA/ max(AREA)) %>%
  ggplot(data = .)+
  geom_sf(aes(fill = AREA))
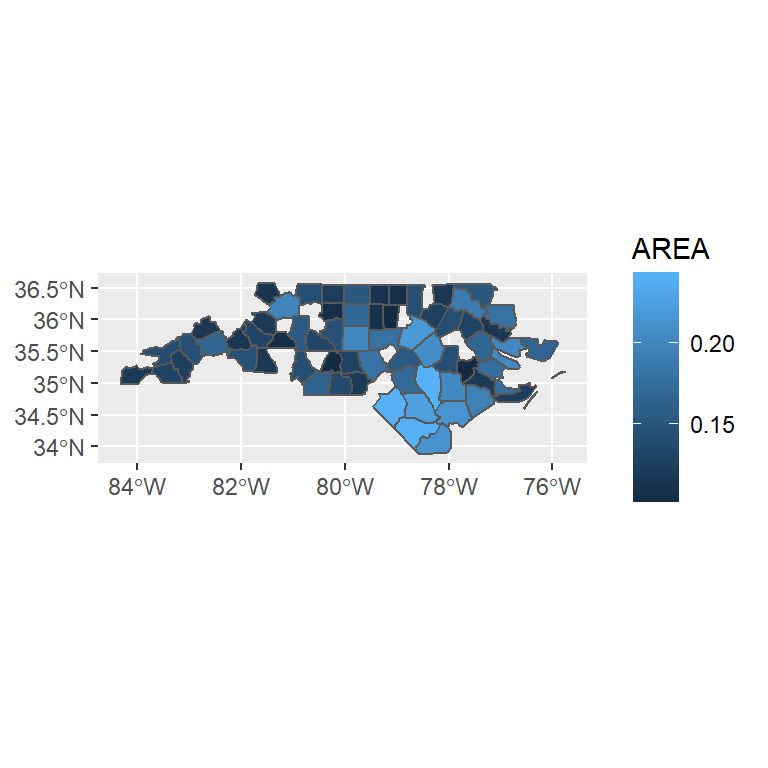
- filter
nc %>%
  filter(AREA > 0.1) %>%
  ggplot(data = .) +
  geom_sf(aes(fill = AREA))
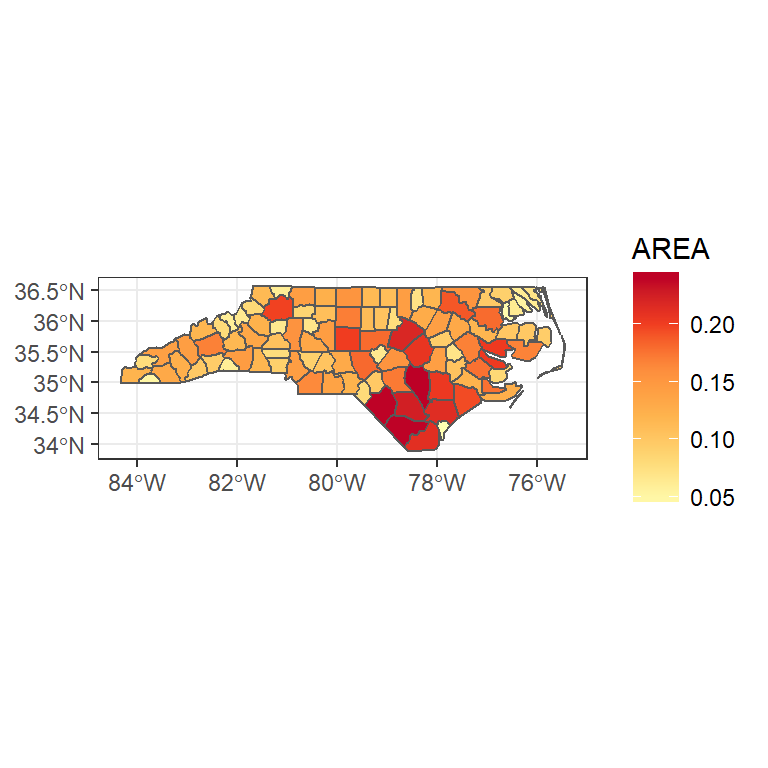
- color gradient
nc  %>%
  ggplot()+
  geom_sf(aes(fill = AREA))+
  theme_bw() +
  scale_fill_distiller(palette = "YlOrRd", direction = 1)
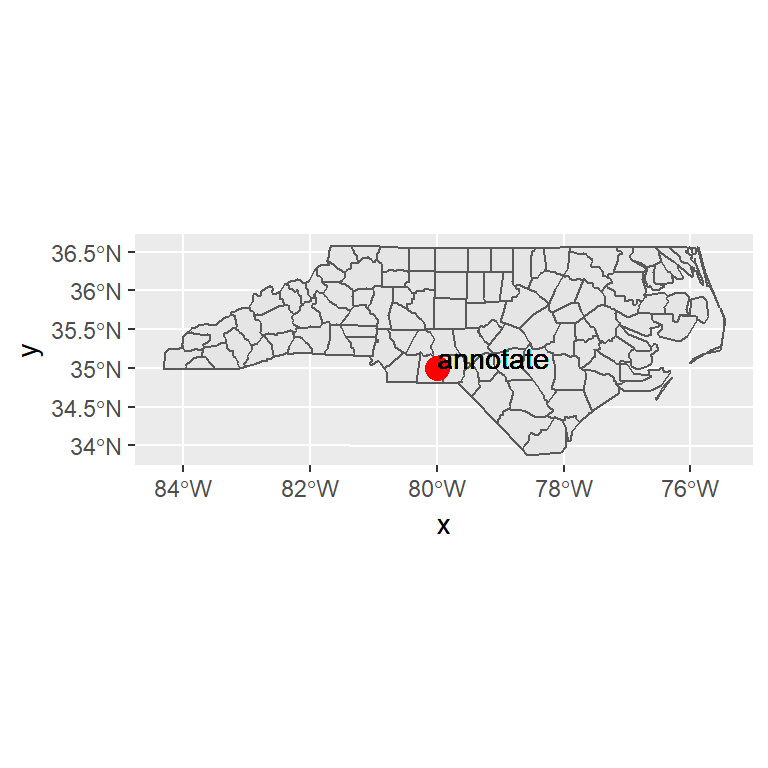
- annotate
ggplot(nc) +
  geom_sf() +
  annotate("point", x = -80, y = 35, colour = "red", size = 4)

ggplot(nc) +
  geom_sf() +
  annotate("point", x = -80, y = 35, colour = "red", size = 4) +
  geom_text(aes(x= -80, y = 35, label = "annotate"), hjust = "inward", vjust = "inward")

ggpairs()できれいなペアプロット
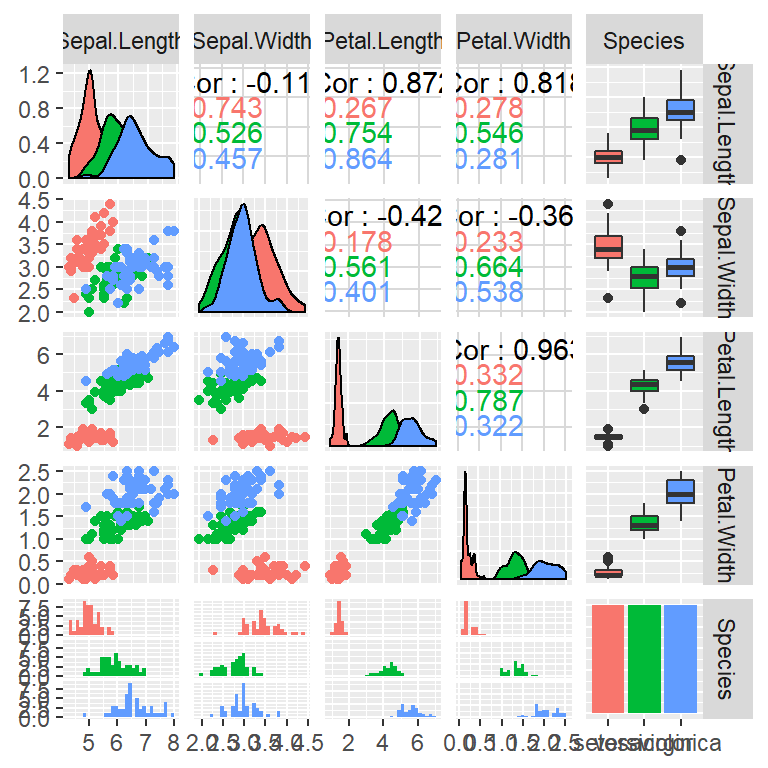
pairs()をggplot2風に書けるらしい。
library(tidyverse)
library(GGally)

iris %>%
  GGally::ggpairs(data = ., aes(color = Species))
rmarkdwonでの参考文献
ヘッダーは下記のようにする。
---
output:
  html_document:
  bibliography: bibdb.bib
  csl: japan-journal-of-industrial-and-applied-mathematics.csl
---
文章中の参考としたところには[@****]と表示してやればよい。
参考文献のスタイルを指定するcslファイルはZetoro style repositoryから自分に合うものを探す。
そして最終行を下記のようにする。(書かなくても表示はされる)
# References
参考したサイト
sfクラスからSpatial*****DataFrameクラスへの変換
Rにおけるジオメトリデータの操作は今後sfパッケージが主流になるらしい。
http://notchained.hatenablog.com/entry/2017/01/06/213333
開発が活発なためせっかく整備したコードが今後も使えるという保証はないため, 利用に少しためらいもあるが,最近少し使っている。
sfクラスからSpatial***DataFrameクラスに変換する際のメモである。
通常は以下のようにas(., "Spatial")で従来のSpatial****DataFrameに変換することができる。
    > nc <- st_read(system.file("shape/nc.shp", package="sf"), quiet = TRUE)

    > > class(nc)
    [1] "sf"         "data.frame"

    > methods::as(nc, "Spatial") %>% class
    [1] "SpatialPolygonsDataFrame"
    attr(,"package")
    [1] "sp"
しかし,tbl_dfクラスも持つ場合にはエラーが生じてしまう。
その場合は以下のようにして,クラスをsf, data.frameにすると解決できる。
    nc %>%
    `class<-`(c("sf", "data.frame")) %>%
    methods::as(., "Spatial")
dplyrにおける文字コード問題が少しは改善されそう
Rにおける文字コードに関して多くの人々が悩まされている.
例えば,
http://notchained.hatenablog.com/entry/2016/04/29/222453
「Why are you using SJIS?」
「Why are you using UTF-8?」
2種類のことばがあり,処理によってうまく扱う必要があるという苦痛。
そんななか,ついに`dplyr`については,問題が解決するようである。
https://github.com/tidyverse/dplyr/pull/2382
issueには文字コードに関する問題外が多く寄せられているが`dplyr`では改善されないような雰囲気を感じていたが,
これまで悩まされていた文字コード問題が少しは?解決されるようでうれしい限りである。
Kirill Müllerさんに感謝。