sf classデータの操作及びプロット
sfパッケージ(クラス)は空間データを簡単に操作することができ非常に便利である。
spパッケージ(クラス)はそれらを扱う多様なパッケージが存在するが、
自分自身で多少の編集を行うのは少し面倒であった。
Simple Features for Rだけあってデータ操作は簡単に行うことができる。
dplyr関係のものもサポートされており、
ggplot2パッケージではこれらのクラスを扱うgeom_sf()関数も開発されており、
今後も開発が活発に行われることが想像される。
簡単な例題を残しておく
- mutate
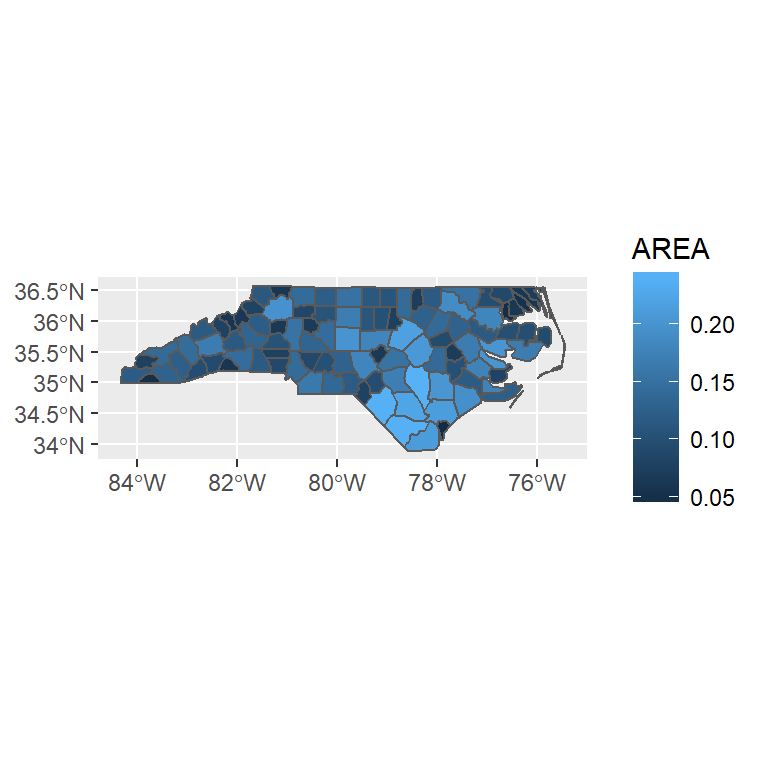
nc <- sf::st_read(system.file("shape/nc.shp", package = "sf"), quiet = TRUE)
nc %>%
  mutate(A2 = AREA/ max(AREA)) %>%
  ggplot(data = .)+
  geom_sf(aes(fill = AREA))

- filter
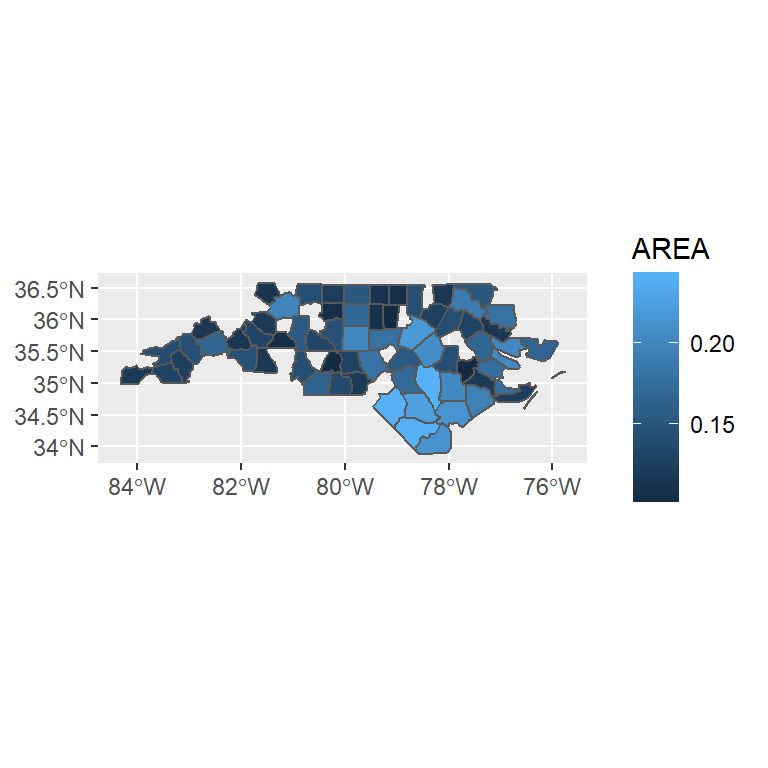
nc %>%
  filter(AREA > 0.1) %>%
  ggplot(data = .) +
  geom_sf(aes(fill = AREA))

- color gradient
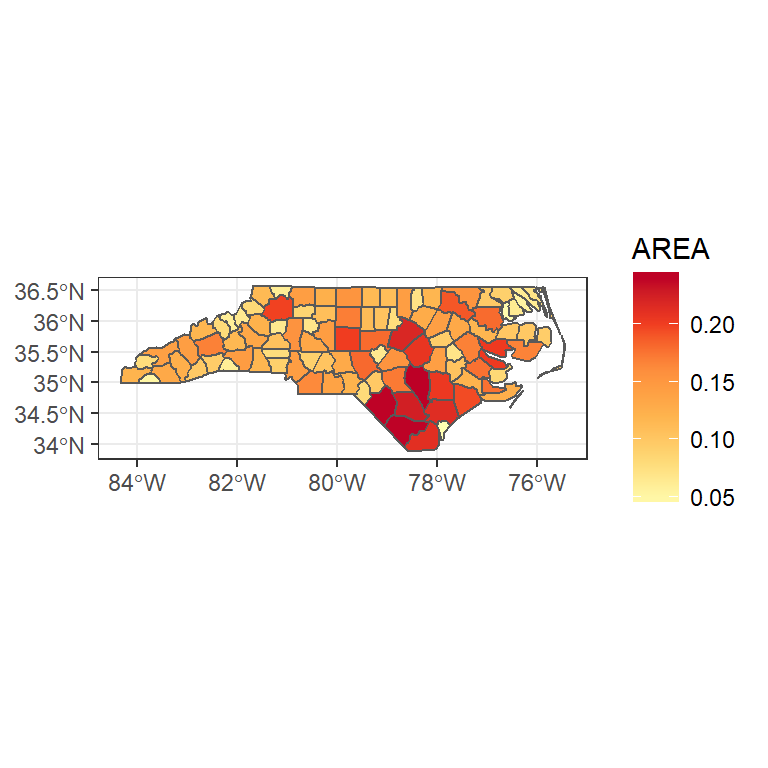
nc  %>%
  ggplot()+
  geom_sf(aes(fill = AREA))+
  theme_bw() +
  scale_fill_distiller(palette = "YlOrRd", direction = 1)

- annotate
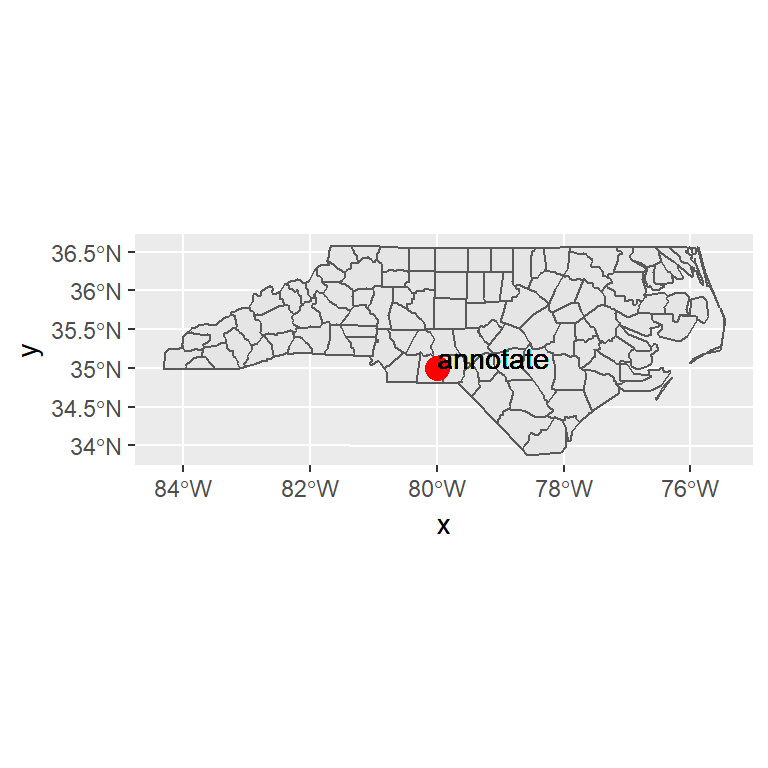
ggplot(nc) +
  geom_sf() +
  annotate("point", x = -80, y = 35, colour = "red", size = 4)

ggplot(nc) +
  geom_sf() +
  annotate("point", x = -80, y = 35, colour = "red", size = 4) +
  geom_text(aes(x= -80, y = 35, label = "annotate"), hjust = "inward", vjust = "inward")

