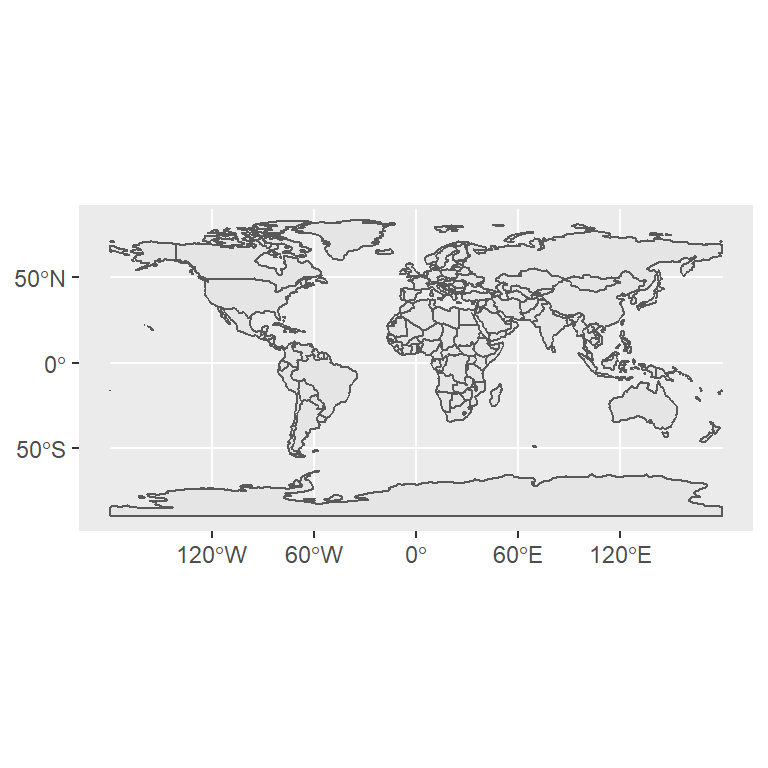
sfオブジェクトをggplot()する場合はgeometryカラムの名前に注意
geom_sf()関数を利用するにあたり
geometryカラムがgeometryではなくgeomの場合にはエラーが出た。
解決方法のメモ。
library(sf)
library(ggplot2)
library(spData)
data(world)
head(world)
Simple feature collection with 6 features and 10 fields
geometry type:  MULTIPOLYGON
dimension:      XY
bbox:           xmin: -73.41544 ymin: -55.25 xmax: 75.15803 ymax: 42.68825
epsg (SRID):    4326
proj4string:    +proj=longlat +datum=WGS84 +no_defs
  iso_a2            name_long     continent region_un       subregion
1     AF          Afghanistan          Asia      Asia   Southern Asia
2     AO               Angola        Africa    Africa   Middle Africa
3     AL              Albania        Europe    Europe Southern Europe
4     AE United Arab Emirates          Asia      Asia    Western Asia
5     AR            Argentina South America  Americas   South America
6     AM              Armenia          Asia      Asia    Western Asia
               type   area_km2      pop  lifeExp gdpPercap
1 Sovereign country  652270.07 31627506 60.37446  1844.022
2 Sovereign country 1245463.75 24227524 52.26688  6955.960
3 Sovereign country   29694.80  2893654 77.83046 10698.525
4 Sovereign country   79880.74  9086139 77.36817 63830.700
5 Sovereign country 2784468.59 42980026 76.15861 18872.967
6 Sovereign country   28656.60  3006154 74.67571  7706.133
                            geom
1 MULTIPOLYGON(((61.210817091...
2 MULTIPOLYGON(((16.326528354...
3 MULTIPOLYGON(((20.590247430...
4 MULTIPOLYGON(((51.579518670...
5 MULTIPOLYGON(((-65.5 -55.2,...
6 MULTIPOLYGON(((43.582745802...
ggplot(world)+geom_sf()

Error in FUN(X[[i]], ...) : object 'geometry' not found
オブジェクトのクラスはdata.frame, sfとなっているにもかかわらず、
先ほどのコードはエラーとなる。
原因はgeometryカラムの名前がgeomとなっていることである。
githubのggplot2にissueとして挙げられており、
geom_sf()にデータを明示的に与える必要があるようである。
もしくは下記のようにaes()にgeometry=geomとすることで解決できる。
class(world)
[1] "sf" "data.frame"
names(world)
 [1] "iso_a2"    "name_long" "continent" "region_un" "subregion"
 [6] "type"      "area_km2"  "pop"       "lifeExp"   "gdpPercap"
[11] "geom"
ggplot(world)+geom_sf(aes(geometry=geom))

なお、geometryカラムの名前がgeometryの場合は問題なくggplot()により作図できる。
nc <- read_sf(system.file("shape/nc.shp", package="sf"))
names(nc)
 [1] "AREA"      "PERIMETER" "CNTY_"     "CNTY_ID"   "NAME"
 [6] "FIPS"      "FIPSNO"    "CRESS_ID"  "BIR74"     "SID74"
[11] "NWBIR74"   "BIR79"     "SID79"     "NWBIR79"   "geometry"
ggplot(nc)+geom_sf()
